xoa.plot.plot_ts#
- xoa.plot.plot_ts(temp, sal, dens=True, ref_dens=0, pres=None, potential=None, absolute=None, axes=None, scatter_kwargs=None, contour_kwargs=None, clabel=True, clabel_kwargs=None, colorbar=None, colorbar_kwargs=None, **kwargs)[source]#
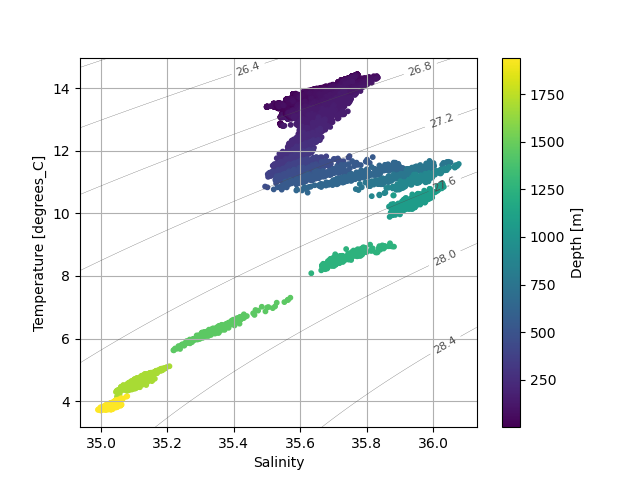
Plot a TS diagram
A TS diagram is a scatter plot with salinity (practical or absolute) as X axis and potential temperature as Y axis. The density is generally added as background contours.
- Parameters:
temp (xarray.DataArray) – Temperature. If not potential, it will be converted into potential if potential=None or potential=False. Note that if temp is not potential and contain a depth coordinate, depth values must be negative (to compute pres with gsw.p_from_z if necessary)
sal (xarray.DataArray) – Salinity (practical or absolute). If not absolute, it will be converted into absolute salinity if the potential temperature needs to be computed.
dens (bool) – Add contours of density. The density is by default computed with function
gsw.density.sigma0()(ref_dens=0).ref_dens (integer, 0) – choice of reference for density calculation (between 0 and 4) ref_dens=0 will consider func:gsw.density.sigma0, etc..
pres (xarray.DataArray, None) – Pressure to compute potential temperature and absolute salinity.
potential (bool, None) – Is the temperature potential? If None, infer from attributes.
absolute (bool, None) – Is the salinity absolute? If None, infer from attributes.
clabel (bool) – Add labels to density contours
clabel_kwargs (dict, None) – Parameters that are passed to
clabel().colorbar (bool, None) – Should we add the colorbar? If None, check if scatter plot color is a data array.
colorbar_kwargs (dict, None) – Parameters that are passed to
colorbar().contour_kwargs (dict, None) – Parameters that are passed to
contour().axes (None) – Matplotlib axes instance
kwargs (dict) – Extra parameters are filtered by
xoa.misc.dict_filter()and passed to the plot functions.
See also
gsw.density,gsw.conversions- Returns:
dict – With the following keys, depending on what is plotted: axes, scatter, colorbar, contour, clabel.
Example
# Register the main xoa accessor
In [1]: xoa.register_accessors()

# Load the Mercator data
In [2]: file_name = xoa.get_data_sample("ibi-argo-7900573.nc")

In [3]: ds = xr.open_dataset(file_name)

In [4]: temp = ds.thetao

In [5]: sal = ds.so

In [6]: depth = ds.depth.broadcast_like(temp)

# Plot
In [7]: plot_ts(temp, sal, potential=True, scatter_c=depth, contour_linewidths=0.2, clabel_fontsize=8, cmap="cmo.deep_r")
Out[7]:
{'axes': <Axes: xlabel='Salinity', ylabel='Temperature [degrees_C]'>,
 'scatter': <matplotlib.collections.PathCollection at 0x72b3b955a350>,
 'colorbar': <matplotlib.colorbar.Colorbar at 0x72b3b9258e10>,
 'contour': <matplotlib.contour.QuadContourSet at 0x72b3b9259810>,
 'clabel': <a list of 6 text.Text objects>}